 What Is A Frequency Response Curve?
We’re going to explore what a frequency response curve is and how it affects your choice of hearing aid. Frequency response curves are a handy way to gauge how a product can reproduce a range of frequencies. However, they also have some important limitations and may not tell you everything about how a product will sound.
What Is A Frequency Response Curve?
A frequency response curve is a graph that depicts the quality of amplitude over a given range of frequencies generated by certain components. These components can be speakers, headphones or other audio equipment. Ideally, a component should reproduce all the audible frequency bands without altering or boosting any particular frequencies. This is called a flat frequency response and a component with this type of curve will be considered accurate by traditional HiFi standards. Frequency response graphs are usually the best way to understand a device’s ability to accurately reproduce frequencies within a given range. They show you the maximum amplitude (or loudness) of each frequency in dB and also show how each frequency is distributed across the entire range.
What Does A Frequency Response Curve Tell You?
Frequency response is the cornerstone of audio–amplifiers, speakers/monitors, headphones, mics, turntable cartridges, CD and DVD players, and every other type of audio product you can imagine. In the audio industry, it’s important that products produce all of the low, middle, and high frequencies correctly – in order to produce sound that sounds natural and believable. This is why frequency response curves are produced. Frequency response graphs can vary greatly from one manufacturer to the next, but what they all have in common is that they represent the results of professional testing under controlled conditions. They are often displayed on the packaging of a headphone or speaker and tell you about how well that particular product can reproduce sound.
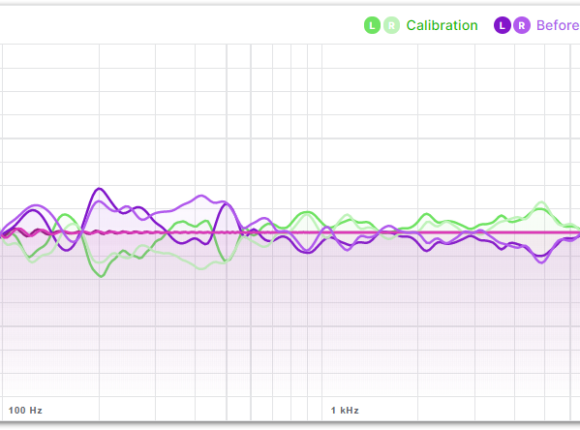
How To Interpret A Frequency Response Curve
A frequency response chart is a diagram that displays how a specific product or component reacts to sound over a range of frequencies. It often features a vertical (y) axis and a horizontal (x) axis, the former displaying amplitude in decibels and the latter indicating the quality of sound at a given frequency. A frequency response curve can help you understand how well a device can reproduce a specific frequency, which is useful when determining whether or not a product is worth purchasing. It can also help you identify characteristics of a particular product that may not be suitable for your needs or preferences. Ultimately, knowing how to interpret a frequency response curve can help you choose the right headphones or mic for your application.
How This Data Affects Your Choice Of Hearing Aid
This data is important because it will help you choose a hearing aid that is best for you and your unique listening needs. If you have a lot of low-frequency sounds in your environment, for example, it may be more important to consider a hearing aid that can handle these frequencies. If you have a lot of high-frequency sounds, on the other hand, it might be more important to consider a hearing aid with more gain. This will ensure you can hear these frequencies more clearly!